If you want to dive into colorimeters, we must first understand the colorimetric theory. Before the analyst attempts to perform colorimetric analysis, it is important to understand the theoretical aspects of the technique. The relationship between concentration and the light absorbed is the basis of theoretical consideration:
Concentration and Light Absorbance
The seemingly obvious way of taking readings on ATO colorimeter is to measure % transmission and adjust the ‘blank’ to 100%. For example, consider a situation where a blank is measured followed by three standard solutions having concentrations of 1, 2, and 3 units, respectively. Ideally, a colorimeter should be giving concentration readings directly, but consider the above solutions when analysed. The solution with a concentration of 1 unit reduces the light to 50% Therefore, the solution with a concentration of 2 units will reduce the light to 25% and the solution with a concentration of 3 units will reduce the light to 12.5%.

Therefore if the colorimeter is calibrated using a % transmission scale, the following graph is produced.
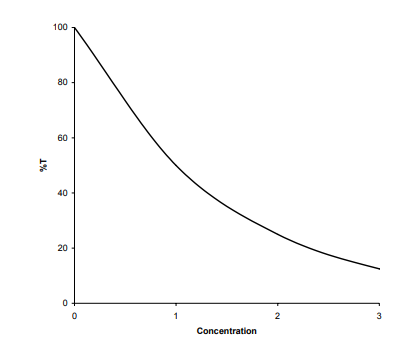
The calibration in %T has the drawbacks of being nonlinear and readings decreasing with increasing concentration. Bonguer first investigated this type of relationship for changes in the thickness of solid materials. His work was followed by Lambert and Beer in 1852, who extended the studies to solutions. All three investigators contributed what is universally known as The Beer-Lambert Law. This states that the light transmitted through a solution changes in an inverse logarithmic relationship to the sample concentration. In order to take measurements both directly and linearly in terms of concentration, %T readings must be converted into an inverse logarithmic form which is called optical density units (OD) or absorbance (A). The formula is:
OD= log (100 / %T)
Therefore, for the given example, the relationship of OD to concentration is shown in the table below.
| Concentration | %T | OD |
| 0 | 100 | 0 |
| 1 | 50 | 0.3 |
| 2 | 25 | 0.6 |
| 3 | 12.5 | 0.9 |
A calibration curve of OD against concentration will be linear and directly proportional.

Optical density (absorbance) is used for colorimetric analysis so that readings relate directly to concentration. Similarly, optical density changes directly with sample path length. Thus we arrive at: Abs =Ecl
A= Absorbance
E= Extinction coefficient or molar absorbtivity
c=Concentration
I= Path length
I is fixed by the path length of the cuvette and E is a constant for each species hence:
A α C
Absorbance is directly proportional to concentration.